Charlotte Market Pivot: What Longer DOM (Days On The Market) Means for Your Next Move

Hey Charlotte, I am tracking a subtle shift that matters. Homes are taking a bit longer to go from list to close, sellers are negotiating a touch more, and inventory is building. Strategy now decides who wins.
Here is a 90-second snapshot
Percent of original list price received: 95.3% for August sellers are gave back about 4 to 5 percent from the initial asking price.
Months of supply: 3.4 months across the region. That is movement toward balance, not a buyer’s market yet.
List to close time: 93 days in August. Plan for a longer runway from launch to sold.
Median sales price: $400,000 for August. Prices are holding while leverage shifts.
Inventory pulse: Inventory expanded year over year and reached about 11,900 homes for sale by early September. Our regional supply is about 3.3 months. More choice is flowing to buyers.
What this means for SELLERS
Price for today’s market, not last spring. With average outcomes near 95 percent of the original list price, smart pricing protects momentum and your net.
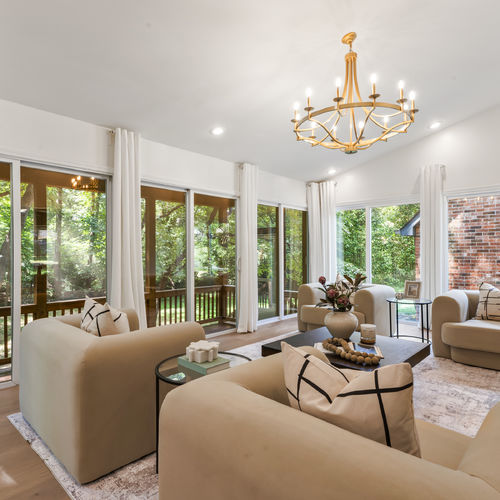
Presentation wins. In a 3 to 4 month supply environment, dialed-in preparation, lighting, and landscaping separate fast movers from price-cutters.
Timeline check. Expect about 3 to 4 months to go from list to close. Lock in contractor dates, moving plans, and your next loan strategy early.
My offer: Book a 15-minute Right-Now Pricing Audit. I will bring micro-comps, absorption, and a 30-day launch plan for your street.
What this means for BUYERS
More selection, less sprinting. As supply rises and timelines stretch, you can tour thoroughly and still compete with confidence.
Negotiate with intent. With the percentage of original list price near 95%, target credits that improve your monthly payment, for example, a seller-funded rate buydown.
Payment plan over sticker price. A moderate price win plus a buydown often beats a deeper price cut with no credits.
Want an edge: Ask me for my Zip-by-Zip Buyer Heat Map. I will flag pockets where days on market and list-to-close are lengthening the fastest, so we can time the offer.
Investor and move-up plays I like right now.
Amenity-rich hubs in SouthPark, Madison Park, and Ballantyne. Inventory is deeper, rents are resilient, and exit liquidity is strong. Data shows stable pricing with more room to negotiate terms.
Near-core value hunts around NoDa, Plaza Midwood, and Belmont. Longer timelines create space for inspections, repair credits, and creative financing. Pair purchase strategy with rent comps and 12-month absorption trends.
Strategy corner: how I am advising clients this week
Sellers: Pre-inspect, then price within 1 to 2 percent of the most recent true comp. Launch with premium visuals and publish a seller credit option for a temporary buydown on day one. This defends your net in a 95 percent environment.
Buyers: Keep offers clean, not careless. Use appraisal gap caps, prioritize systems on inspections, and structure a seller credit that lowers payment more than a small price cut would.
Investors: Underwrite at 3.3 to 3.4 months of supply and 95 percent of the original list price. Assume a longer stabilization window and capture value via concessions.
Want the numbers for your street?
Reply with your address or your zip. I will send a 2-page Micro-Market Brief with DOM trendlines, absorption, negotiation ranges, and three realistic pricing or offer paths so you can move with confidence.
Check out this article next
